
A decade ago, checking one's recovery meant little more than a groan while climbing stairs the morning after leg day. Now a small industry of wearables, apps and dashboards promises to quantify that groan, attaching numbers to resting heart rate, heart rate variability and perceived soreness, then bundling them into a tidy readiness score. The appeal is obvious: training is easier to plan when the body's state is expressed as data rather than mood.
The trouble is that these metrics are frequently misread, either taken too literally or dismissed as gimmicks once the first confusing reading appears. This article looks at what each number actually measures, where its limits lie, and how the three might be used together without turning morning coffee into an anxious ritual of checking a screen.
Why recovery tracking became mainstream and what it promises
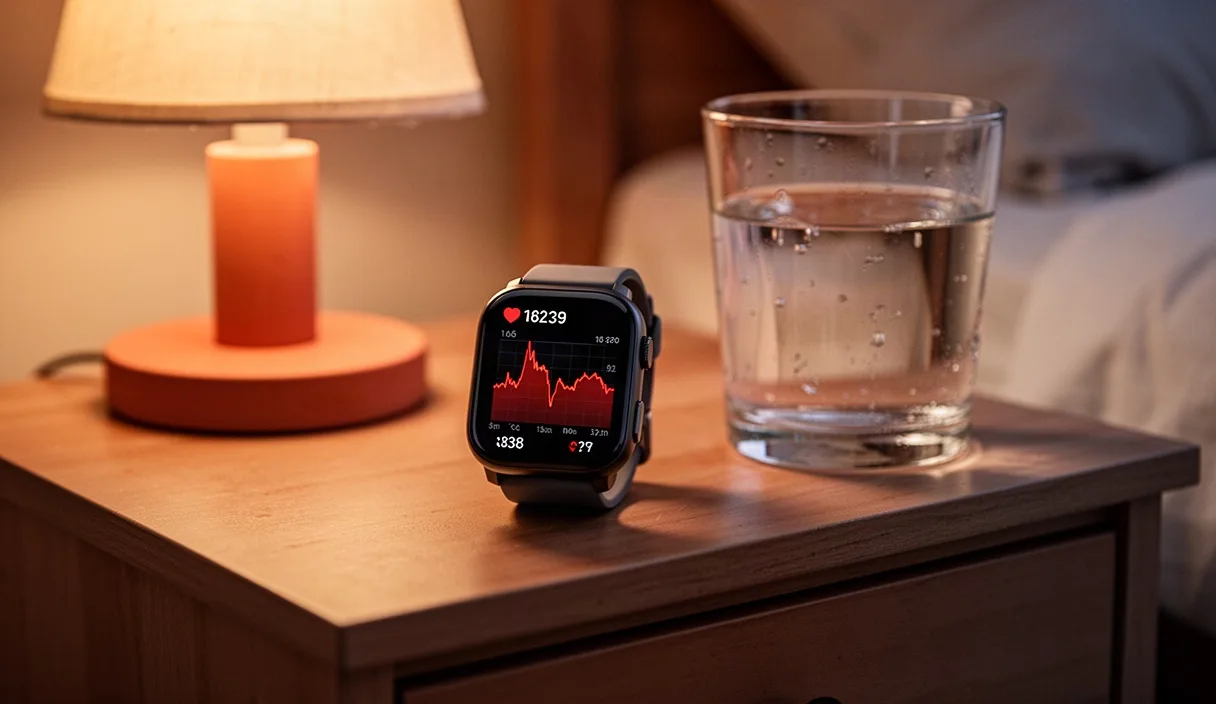
Recovery tracking moved from sports science labs to consumer wrists once affordable optical sensors and, later, more accurate electrical sensors made continuous heart data collection possible outside a clinic. Companies such as Whoop, Garmin and Oura built entire products around the idea that a single "readiness" or "recovery" score could tell someone whether to train hard or ease off, replacing guesswork with something that looked scientific.
The promise is straightforward: fewer overtraining injuries, better timed rest days, and training plans that adapt to the body's actual state rather than a fixed weekly template. For athletes juggling multiple sessions a week, that has genuine value, since fatigue accumulates unevenly and a fixed schedule can push through a day when the body needed rest, or waste a day when it was ready for more.
What the promise glosses over is variability. A resting heart rate reading taken with a wrist sensor can differ from a chest strap reading by several beats per minute, and heart rate variability is sensitive to sleep position, room temperature and even how tightly a band is worn. Recovery scores are estimates built on assumptions, not direct measurements of muscle repair or central nervous system fatigue, and treating them as verdicts rather than clues sets up unrealistic expectations.
What resting heart rate actually reflects
Resting heart rate, usually measured first thing in the morning before getting out of bed, reflects how hard the heart is working to circulate blood in the absence of physical or emotional demand. For most healthy adults it sits somewhere between 60 and 80 beats per minute, though well conditioned endurance athletes often see readings in the 40s and 50s because a stronger heart moves more blood per beat.
Over weeks and months, a downward trend in resting heart rate at a similar training load is one of the more reliable signs that cardiovascular fitness is improving. A short term spike, on the other hand, tends to reflect something more immediate: poor sleep, dehydration, alcohol the night before, an oncoming illness, or accumulated fatigue from several hard training days in a row. A rise of 5 to 10 beats per minute above a person's own baseline is generally considered worth noting, though it is not a diagnosis of anything specific.
The number is most useful as a personal baseline rather than a comparison point between people, since resting heart rate is influenced by genetics, medication, caffeine intake and even body temperature on a given morning. Someone taking a beta blocker, for instance, will have a resting heart rate that says little about their fitness relative to someone who is not.
- Typical adult range: 60 to 80 beats per minute at rest.
- Trained endurance athletes: often 40 to 55 beats per minute.
- Meaningful daily change: a rise of roughly 5 to 10 beats above one's own average, sustained for more than a day.
Anyone who sees a resting heart rate persistently above 100 beats per minute at rest, or a sudden unexplained drop, should mention it to a doctor rather than a coach, since that range moves into territory better assessed clinically.
How to interpret HRV without overreacting to daily swings
Heart rate variability measures the tiny fluctuations in time between individual heartbeats, a pattern governed largely by the balance between the sympathetic nervous system, which drives the fight or flight response, and the parasympathetic nervous system, which governs rest and digestion. Higher variability generally suggests the body is leaning toward a recovered, parasympathetic dominant state, while lower variability suggests ongoing stress, whether physical, mental or both.
The number that matters is not HRV in isolation but HRV relative to a person's own rolling average, typically calculated over the past 7 to 14 days. A single night's reading of 45 milliseconds means very little without that context; the same value could represent a normal day for one person and a significant dip for another. Most tracking apps handle this comparison automatically, showing a percentage above or below baseline rather than a raw number, which is the more useful figure to actually look at.
HRV is notably sensitive to factors that have nothing to do with training: a late dinner, a stressful email at 11pm, air travel, alcohol, or even a cold room can suppress it for a night. This is why sports scientists generally recommend looking at three day trends rather than reacting to any single morning's reading. A drop of 20 to 30 percent below baseline sustained across three consecutive mornings is a more meaningful signal than one bad night that coincides with, say, a late flight.
| Pattern | Likely meaning | Suggested response |
|---|---|---|
| Single day dip, otherwise normal week | Noise from sleep, alcohol or stress | Train as planned |
| Three or more consecutive low readings | Accumulated fatigue or incoming illness | Reduce intensity or take a rest day |
| Steady upward trend over weeks | Improving fitness or reduced life stress | Consider a gradual increase in training load |
The limits of soreness as a recovery signal
Delayed onset muscle soreness, the stiffness that peaks 24 to 72 hours after unfamiliar or eccentric heavy exercise, is the oldest recovery metric there is, predating any wearable by millennia. It is also one of the least reliable, because soreness reflects microscopic muscle damage and inflammation, not the readiness of the nervous system or the cardiovascular system to perform again.
A lifter can feel intensely sore in the quads two days after a heavy squat session yet have a perfectly recovered nervous system capable of a strong upper body session that same day. Conversely, someone can feel almost no soreness after a session yet be carrying significant central fatigue that shows up as sluggish reaction time or reduced power output, something soreness alone will never reveal.
Soreness also fades with repeated exposure to the same movement pattern, a phenomenon known as the repeated bout effect, meaning an experienced lifter doing their regular routine may feel almost nothing even after a genuinely demanding session. Relying on soreness as the sole gauge of whether to train again risks two mistakes: skipping sessions that would have been fine, and pushing through fatigue that soreness simply did not register.
Where soreness remains useful is as a rough gauge of novel training stress, particularly for beginners or for anyone returning after a break. Sharp, localized pain during a movement, as opposed to the dull ache of typical soreness, is a different signal entirely and warrants stopping the activity and, if it persists beyond a few days, checking with a physiotherapist or doctor.
Combining metrics instead of relying on one number
Each of the three metrics discussed answers a different question. Resting heart rate speaks to general physiological stress over the medium term. HRV speaks to autonomic nervous system balance on a given morning. Soreness speaks to localized muscle damage from recent training. None of them, alone, describes overall readiness, which is why single number "recovery scores" tend to smooth over more nuance than they reveal.
A more useful approach treats the three as a simple checklist rather than a formula. If resting heart rate is elevated, HRV is trending down over several days, and soreness is unusually high after a normal session, that combination is a reasonably strong signal to scale back. If only one metric looks off while the other two are normal, it is often just noise.
- Check resting heart rate against the personal average from the last two weeks, not against a generic chart.
- Look at the HRV trend over three days rather than the single morning reading.
- Note soreness location and intensity, distinguishing dull ache from sharp or joint related pain.
- Cross reference with sleep duration and quality, since poor sleep will distort both heart rate and HRV independently of training.
- Only adjust the day's training if two or more signals point the same direction.
Subjective feel still deserves a place in this checklist. Athletes who have trained for years often sense fatigue before any metric registers it, and dismissing that instinct in favor of a dashboard number is its own kind of error.
Common mistakes
The most frequent mistake is checking recovery data first thing in the morning and letting a single low reading dictate mood and motivation for the entire day, effectively outsourcing self-assessment to a sensor that was never designed for daily emotional weather reports.
A second mistake is comparing one's own numbers to a training partner's or to published averages, when resting heart rate and HRV are both highly individual and shaped by genetics, age and medication in ways that make cross-person comparison close to meaningless.
A third mistake is ignoring the basics that drive these numbers in the first place, chiefly sleep consistency, hydration and alcohol intake, and instead treating a poor reading as a training problem to be solved with more rest days rather than a lifestyle pattern to be addressed directly.
Practical next steps
Anyone starting to use these metrics should spend the first two to three weeks simply collecting baseline data without changing training at all, since a single week rarely reflects a stable average for either resting heart rate or HRV.
After that baseline period, apply the checklist approach above, adjusting a single session at a time rather than overhauling an entire week's plan based on one metric. Persistent, unexplained changes in resting heart rate, particularly readings sustained above 100 beats per minute at rest or accompanied by dizziness, chest discomfort or unusual fatigue, warrant a conversation with a doctor rather than a training decision. Used with that kind of restraint, these numbers become a useful supplement to how the body actually feels, rather than a replacement for it.